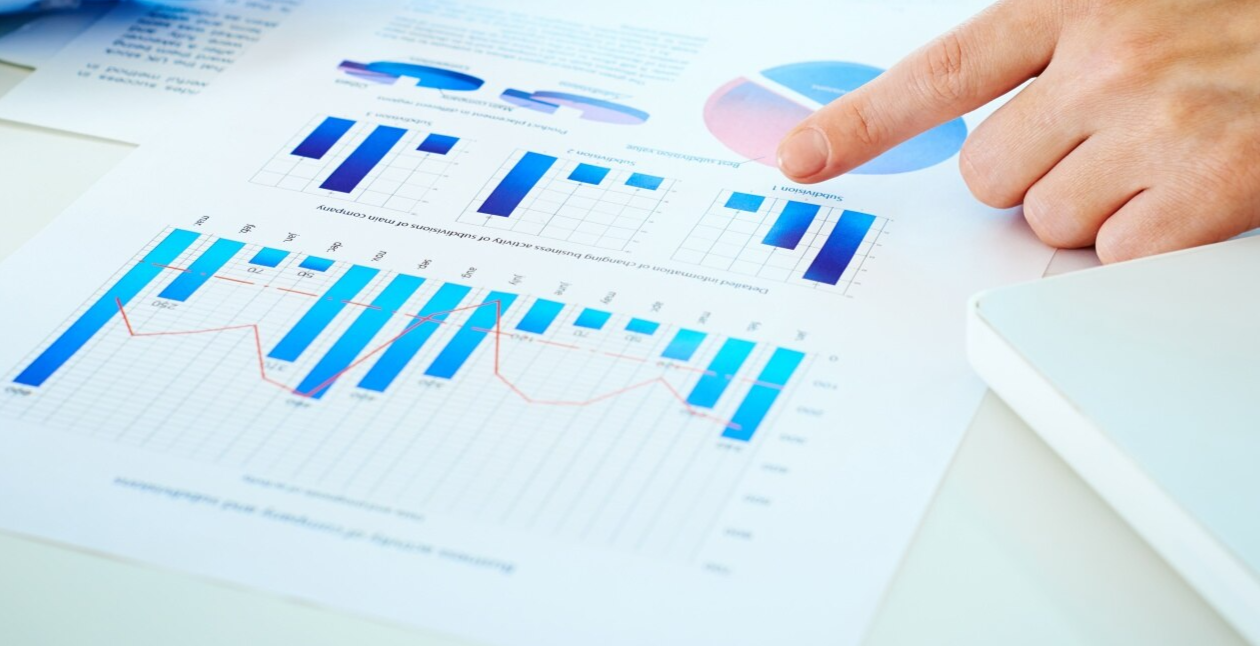
Undoubtedly, turning raw data into graphical insights is no longer a luxury; it’s a necessity to maintain competitiveness. With Neuquip, transforming massive loads of datasets into clear, actionable visualizations is now seamless using our AI tool. It is carefully designed for data-intensive industries such as ICT, telecom, ride-hailing businesses, and also food delivery platforms. Neuquip is your one stop shop to deliver clarity and efficiency- empowering you to make smarter, faster decisions.
Why It Matters
The Data Explosion
One the major challenges aforementioned businesses today face is an overwhelming influx of raw data. Whether it’s real-time logistics for a ride-hailing service or financial reporting for ICT companies, managing and interpreting data is in fact daunting.
Why Visual Insights Are Crucial
The game has changed! Raw data alone holds little worth unless it can be analyzed, transformed and acted upon. In recent history, visual insights have revolutionized and by making trends, and opportunities unambiguously clear. With Neuquip, businesses can eliminate guesswork and unlock deeper understanding of the data and ultimately their business needs.
Your Competitive Edge
Neuquip’s meticulous R&D is based on years of practical work experience of data analysts and industry leader. We know that pain! Now imagine presenting your tons of complex data as visually compelling charts, dashboards, or infographics conveys the key message flawlessly. This capability not only enhances internal decision-making but also strengthens communication with stakeholders, giving you an undeniable edge.
How to Transform Raw Data into Graphical Insights with Neuquip
1- Streamline Data Integration
Neuquip effortlessly integrates data from multiple sources, whether it’s spread sheets, APIs, or cloud services. Ofcourse the latter will be a part of Neuquip’s future expansion, but the spreadsheet and other format functionalities are working like a charm. Forget manual usage of complicated spreadsheets Neuquip’s user-friendly platform automates the number crunching a piece of cake, ensuring accuracy and efficiency.
2. Create Custom Dashboards
Using Neuquip’s innovative Sketchbook feature, we welcome you to tailor your insights to what matters most. Build your dashboards easily that focus on KPIs exclusive to your industry, whether tracking delivery times in food services or analyzing network uptime in telecom. Your state-of-the-art product FinSight360 provides generative AI feature, where ‘your wish is our command’.
3. Leverage AI for Automated Visualization
Neuquip’s AI tools transform raw data into meaningful visuals with minimal input. Simply drag and drop your raw data file, be it spreadsheet, a PDF or a txt file, mention your desired output by providing a prompt to ‘Neuquip buddy’ to generate graphs, heatmaps, or pie charts. Isn’t it amazing?
4. Real-Time Analytics
Neuquip allows you to effortlessly keep pace with your operations. FinSight360 provides real-time graphical insights, helping you make decisions faster and stay ahead of potential issues.
5. Ensure Data Security
Your data safety is non-negotiable for us. We also provide a ground-breaking secure enterprise-grade browsing called NBrowser. Yes, you can trust that your insights remain private and aligned with industry regulations.
Benefits of Using Neuquip for Graphical Insights
Simplified Decision-Making
Neuquip’s provides easy visual insights and eliminate complexity, enabling businesses to make data-driven decisions faster.
Cross-Industry Applicability
When we say Neuquip is your one-stop-shop, we mean it! From telecom giants to ride-hailing startups, any business relying on large datasets can benefit from Neuquip’s tools.
Enhanced Collaboration
Neuquip empowers its used to have graphical insights that are super easy to share and discuss, nurturing better partnership across departments or with external stakeholders.
Credibility Through Expertise
Without a shadow of a doubt, Neuquip has been meticulously developed with deep expertise in data analysis and visualization, ensuring the most advanced and reliable solutions for data needs of businesses.
How to Start Using Neuquip Today
- Visit the Website: Explore the features tailored to your industry at neuquip.com
- Sign Up: Choose the right plan for your needs and start making smarter decisions today.
In the competitive world of data-driven industries, transforming raw information into meaningful visual insights is key to success. Neuquip simplifies this process, helping you harness the full potential of your data for better decision-making and stronger outcomes. We are the only place to have a complete solution from your data needs, from analysis to sharing reports to decision making – with the power of AI and our groundbreaking algorithm which aims taking businesses to new heights.
Don’t let your data go to waste. Click here to explore Neuquip and discover how easily you can transform raw data into powerful graphical insights. Start today and gain the clarity you need to lead your industry tomorrow!


